
Click any of the tabs or subtabs above to view the main help page for your selection.
Considerations
Performance measures are statistics summarizing your personal rates of return, which aids in the analysis and on-going monitoring of historical security selection decisions, evaluating investment managers, and providing input for future investment and tax related decisions.
Procedure
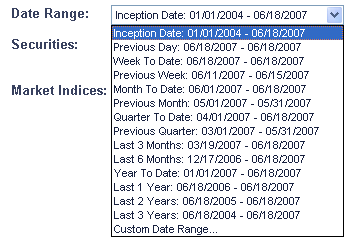
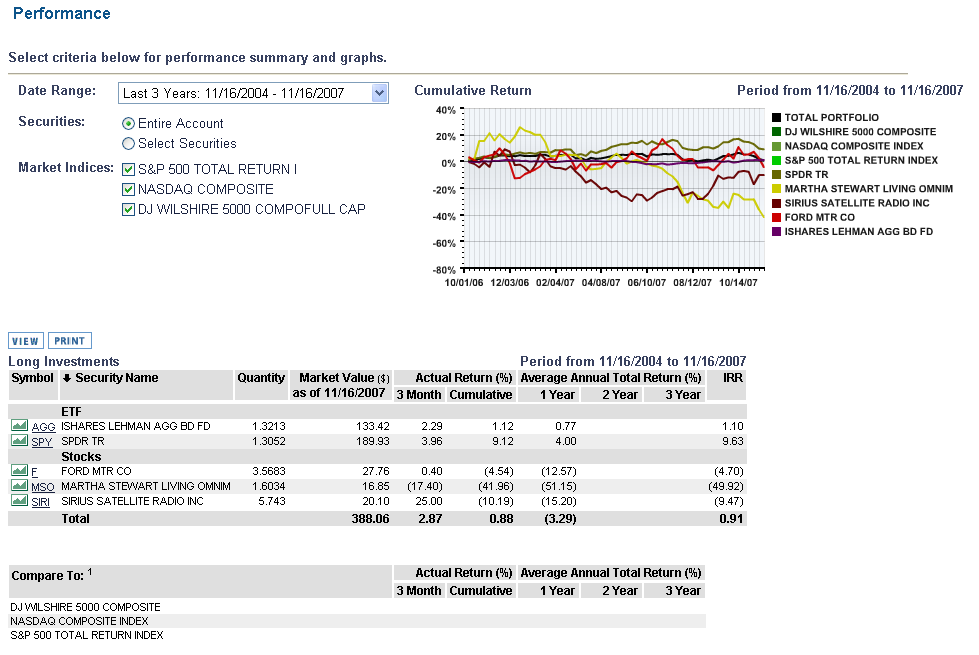
From the Zecco navigation panel, Performance. The Performance Reporting page displays. By default, your Cumulative Return displays. This time period represents the total return from inception of the security/portfolio through last night. To change this view, select a different date range from the Date Range drop-down list. Click here to view an example of the options in the Date Range list.
You have the ability to narrow the portfolio view to select either a single security, or a group of securities. By default, the Entire Account option is selected. This means that performance information for your entire account is displayed on this page. To change this, select the Select Securities radio button. Once you do this, a list of securities displays. You can select one or multiple securities (using the Ctrl button). If you select a specific security or securities to view, the performance for only those selected will display on this page. Once you have completed your selection, the page will refresh automatically and display the requested information.
Measuring returns in isolation has limited meaning unless the value can be compared against something relevant. To be meaningful, the time-weighted return (not IRR) should be judged against an appropriate comparative benchmark with a historical perspective. You have the ability to narrow the benchmark results displayed. The market indices list enables you to select from all available benchmarks. Select the checkbox next to the benchmark(s) you would like included in your results. Once the benchmarks have been selected, the display will automatically refresh, presenting the requested information. Click here to view an example of the benchmark list.

Note: Currently, Zecco does not have information for the displayed market indices.
Repeat the above steps to change the performance information that is displayed.
Click any of the links below for more information on the selected section.
This column displays the letters that identify the security. They are used for trading purposes. The graph symbol may be used to link directly to an individual security displaying a return graph and chart. This column can be sorted.
This column contains the full name of the security. This column can be sorted.
Your security positions as-of the last day of the date range selected. For example, equity and mutual fund holdings display the shares you own, bonds are displayed in units and options display the number of contracts. This column can be sorted.
The market value of the security position as-of the last day of the date range selected. Market values are updated in a nightly cycle and reflect prices as-of the nightly close or the last available price. This column can be sorted.
A return that reflects both capital appreciation (realized and unrealized) plus income, net of fees. Returns aggregate various components of account data, including positions, price, income, and transactions. This return is calculated daily and geometrically linked for the time period displayed. These returns are suitable for comparison among the same time period and with benchmarks. These columns can be sorted.
A total return from inception of the security/portfolio to the end date selected. This return is calculated daily and geometrically linked for the time period displayed. These returns may not be suitable for comparison amount other holdings and benchmarks if the holding time periods differ. This column can be sorted.
A multi-year return converted to an annual basis. Periods greater than 1-year are generally stated on an annual basis. Returns are represented such that the annualized result represents the yearly return needed to be earned for each of the years in the period in order to derive the overall period result. Many investors annualize returns to make it easier to compare historical results. These columns can be sorted.
A method of calculating returns that are influenced by both the timing and size of the investment activities. This is often referred to as the dollar weighted rate of return or internal rate of return (IRR). While the IRR provides much insight into your trading strategy, it is not suitable to compare the individual results against other IRRs or benchmark results given the unique impact of the timing of each investment decision. This column can be sorted.
Example
Click here to view an example of the Portfolio Performance page.
Click on the images below to view additional information on the selected section(s).
![]()